Two Sigma · Study
Two Sigma Research Scientist Interview Process
TrueInterview
July 24, 2026 · 12 min read
The Two Sigma Research Scientist loop is built on classical statistics and applied modeling, with the code kept deliberately small. Candidates derive correlation bounds and omitted-variable bias by hand, defend a demand forecast feature by feature, and then write a short string or array routine; deep learning breadth rarely comes up. Open-ended prediction cases carry more weight than candidates expect: a research-track candidate who handled a resume deep dive and a graph-probability problem well was rejected after an unstructured answer on predicting stock prices from social media text.
This guide breaks down each stage of the Two Sigma Research Scientist interview, what interviewers evaluate in each round, and how to prepare, with questions candidates were actually asked.
Verified: Based on 3 candidate-reported interview experiences, primarily from 2025 Q4 through 2025 Q4, cross-checked against recent public accounts.
Two Sigma Research Scientist interview process
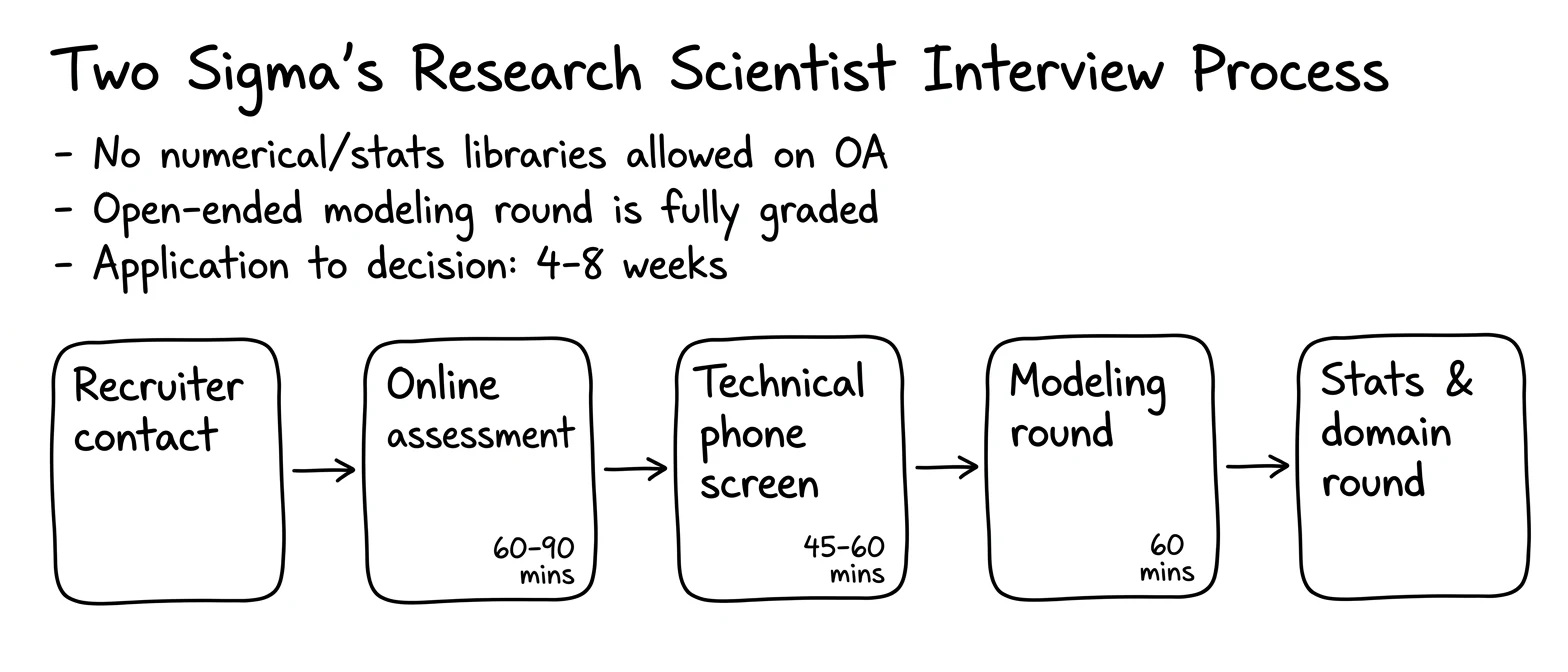
Research hiring spans quantitative research, data science and AI research roles; interviewers come from the hiring group, so content follows its focus. The common pattern is a timed quantitative assessment, one or two phone screens, and a final loop of about three sessions mixing data analysis, statistics and coding, with afternoon conversations with senior researchers usually reserved for candidates who did well in the morning. The process typically takes three to eight weeks.
Experienced hires spend more time on their publications and on how their methods transfer to noisy financial data; for PhD candidates, one onsite segment often becomes an examination of the thesis field.
Here's what the interview process can look like:
- Recruiter contact (varies): A short call on background and logistics; some applicants receive the assessment directly by email.
- Online assessment: About 60 to 90 minutes of linked numerical tasks, usually without numerical libraries.
- Technical phone screen: About an hour on an open-ended modeling problem, a numerical coding task, or a probability problem plus your research.
- Data analysis case interview: A full forecasting problem, most often Citi Bike demand, driven by follow-up questions.
- Statistics interview: Proof-level derivations in correlation, regression and linear models.
- Coding interview: A warm-up and one or two moderate problems, graded on finished code.
- Hiring manager and research conversations: Your research, its fit with the team, and an unconventional question.
Tip: Prepare the modeling case as seriously as the derivations. Have a repeatable structure (target, features, validation, drift, failure modes) and run it on three or four unfamiliar prediction problems; a weak answer here has outweighed clean technical rounds.
Online assessment
The timed test has two or three linked tasks. The first is almost always a piecewise linear interpolator over known (x, y) points, where the grading rests on decisions the prompt leaves to you: clamp to the endpoint or extend the end segments outside the data range, average duplicate x values or keep the last, and define the answer for a single point.
The second task analyzes New York City temperatures in steps: standard deviation, median, a closed-form least-squares fit on day of year and its mean squared error, and in some versions a greedy selection that adds whichever nearby town most reduces prediction error. A third task, when present, is no-intercept regression (the sum of x times y over the sum of x squared), first in batch and then updated from running totals as batches arrive. Statistics libraries are usually unavailable, so the formulas are hand-coded.
Interviewers evaluate:
- Stated edge-case policy: Extrapolation, duplicate and single-point rules chosen deliberately, commented and applied consistently.
- Numerical correctness without libraries: Variance, median and least squares computed from first principles.
- Efficiency: Binary search over sorted x values rather than a scan per query.
- Coverage across tasks: Every task scores separately, so each needs a working submission.
Practice the interpolator, the temperature statistics and the no-intercept slope until each takes under 20 minutes in plain Python without imports.
Note: The common failure is the clock, not the math. Research-track candidates who polished the interpolator's boundary cases submitted the later regression parts incomplete. Get every task working first, then refine.
Sample questions for the online assessment
Here are some questions reported by recent candidates:
-
Implement linear interpolation over points with duplicate x values and out-of-range queries, stating your policy for each.
-
From daily New York City weather data, compute summary statistics, fit temperature against day of year, and report the error.
Technical phone screen
The screen runs about an hour with a researcher and takes one of three forms. The data science form is a single modeling problem for the whole hour: predicting a stock's price from search-trend data, with follow-ups on target definition, regularization and cross-validation, model choice, seasonality, when an ensemble is worth it, and drift in both the mean and the variance after deployment.
The numerical form is a live version of the assessment: an interpolator class that removes duplicate x values and uses binary search, the no-intercept slope, and the running sums that make each streaming update constant-time. A variant estimates temperature from the three nearest weather stations by inverse distance weighting, then asks about a size-k heap versus sorting and about fewer than three stations. A third form pairs a research review with a probability problem.
Interviewers evaluate:
- Precise targets: Price level, return or direction over a stated horizon, before any features.
- Mechanism behind features: Why a search term should lead the price and how fast the signal decays.
- Non-stationarity: Telling drift in the mean from drift in the variance, with a monitoring or retraining response to each.
- Depth under questioning: Answers that hold four or five questions deep; a memorized pipeline runs out after two.
Talk through two or three alternative-data prediction problems aloud, start to finish, in under 45 minutes each.
Sample questions for the technical phone screen
Here are some questions reported by recent candidates:
-
Predict a company's stock price from search-trend data, covering target definition, overfitting, seasonality, ensembles and drift.
-
Use social media posts to predict stock prices, including the noise in the data and how you would backtest.
-
In a complete graph with random edge weights, find the expected number of pairs whose direct edge is their shortest path.
-
Predict a Company's Stock Price from Six Years of Web Search Logs
-
Expected Number of Good Pairs in a Randomly Weighted Complete Graph
Data analysis case interview
Both onsite reports on this track include the same case: forecasting Citi Bike demand at one station, hourly or daily. Candidates are expected to cover trend and seasonality, weather, nearby events and neighboring stations, then outline a pipeline and its evaluation. Expect an hour of defending choices rather than presenting. Related research-track cases are New York housing prices (missing values, non-linearity, leakage, a pandemic-sized shock in the history) and testing whether a momentum signal in stocks is real.
Interviewers evaluate:
- Time-aware validation: Splits that respect time order and a reason for the error metric.
- Leakage spotted early: Features that would not exist at prediction time, raised before being asked.
- Feature reasoning: Why weather, holidays or events should move demand at this particular station.
- Overfitting control: Regularization and feature selection explained through the bias-variance trade-off.
Run the Citi Bike case end to end on paper, including post-launch monitoring.
Sample questions for the data analysis case interview
Here are some questions reported by recent candidates:
-
Predict hourly or daily bike counts at a specific Citi Bike station and explain how you would validate the forecast.
-
How would you test whether momentum is a genuine source of returns in stocks?
-
How Would You Test Whether Momentum Is a Real Alpha Signal in Stocks?
Statistics interview
This round covers classical statistics and linear models rather than modern machine learning, and moves from definition to derivation to construction. One candidate was given the correlations of x with y and with z and asked for the feasible range of the y-z correlation, which follows from the correlation matrix being positive semi-definite. The candidate then had to build variables reaching both extremes and bound the sum of all pairwise correlations among n variables; the lower bound of minus n over 2 comes from the variance of the sum of the standardized variables.
Other prompts include omitted-variable bias (direction, bias term and matrix form) and the slopes from regressing y on x versus x on y. Their product is the squared correlation, so they are equal only when the two standard deviations match or the correlation is zero. Other research-track prompts: why an L1 penalty zeroes coefficients, and the covariance of the maximum and minimum of n uniforms.
Interviewers evaluate:
- Derivation, not recall: Writing out the least-squares algebra rather than quoting the result.
- Constructive examples: Exhibiting variables that achieve a bound, not just asserting it exists.
- Generalization: Extending a three-variable result to n without guidance.
- Clean matrix notation: The bias written with the included and omitted design matrices.
Rehearse correlation matrices, least squares in matrix form, omitted-variable bias and order statistics until each derivation needs no notes.
Note: Research-track interviewers have stayed silent for most of a session, giving no hints or reactions. That is calibration, not a sign of failure; keep reasoning out loud.
Sample questions for the statistics interview
Here are some questions reported by recent candidates:
-
Given the correlations of x with y and with z, find the range of the y-z correlation, construct examples at both ends, then bound the sum of pairwise correlations among n variables.
-
An important regressor is omitted; derive the bias in the remaining coefficient and write it in matrix form.
-
How do the slopes from regressing y on x and x on y relate, and what would make them equal?
-
Slopes of y-on-x vs x-on-y Regression: Relationship and When They Are Equal
Coding interview
Coding is its own session or the end of a statistics session, with moderate problems and finished code expected. One session opened with a palindrome check, moved to the smallest palindrome strictly greater than a given integer, and ended with splitting 2n workers between two tasks to minimize total time. In another, the candidate received a function that adds two single digits and returns a string with any carry, and had to use it to add two arbitrarily long integer strings from the least significant digit.
Interviewers evaluate:
- Carry and boundary handling: All nines, unequal lengths and leading zeros.
- Using what you are given: Building on the provided helper instead of working around it.
- Complexity on request: Time and space stated and justified.
- Finishing: A complete, tested function rather than an elegant half-built design.
Practice digit-manipulation and greedy assignment problems to completion within 20 minutes each.
Sample questions for the coding interview
Here are some questions reported by recent candidates:
-
Find the smallest palindrome strictly greater than a given integer, including inputs such as 999.
-
Assign 2n workers to two distinct tasks so the total time to complete both is minimized.
Hiring manager and research conversations
Closing conversations with managers and senior researchers probe your research methods, results and personal contribution. Research-track onsite sessions have shared one shape: a short coding problem, deep questions on your academic field from unexpected angles, and an unconventional problem to watch how you handle ambiguity. These conversations count; candidates have been rejected after them without a specific reason.
Interviewers evaluate:
- Personal contribution: What you did, as distinct from your lab or team.
- Transfer to markets: How your methods behave on noisy, non-stationary data.
- Composure on unfamiliar problems: A sensible first approach to something you have never seen.
- Research judgment: Which experiments you would run first and which you would drop.
Prepare a 10-minute walkthrough of your strongest project and the three questions it most invites.
How Two Sigma levels and evaluates Research Scientist candidates
The hiring group weighs all rounds together, and afternoon manager sessions usually depend on a strong morning. A warm, engaged interviewer has not meant an offer, and rejections arrive without detailed reasons. Two Sigma does not publish a level ladder for research roles: campus hires apply to a defined entry role, while experienced candidates are placed on their research record.
How to prepare for the Two Sigma Research Scientist interview
- Build a modeling-case template: Target, reasoned features, time-aware validation, leakage, drift and monitoring, practiced on bike demand, housing and search data.
- Derive the classical results by hand: Correlation-matrix bounds, omitted-variable bias in matrix form, and the y-on-x versus x-on-y slopes.
- Code numerical routines without libraries: Interpolation, median, variance and closed-form least squares in plain Python.
- Take the assessment against a timer: Every task working first, edge-case polish second.
- Finish moderate problems completely: Palindromes, big-number string arithmetic and greedy assignment, with complexity stated.
- Know your research cold: Your own contribution, its weaknesses, and how it would hold up on market data.
- Practice explaining into silence: Rehearse derivations aloud with no feedback.
About the Two Sigma Research Scientist role
Two Sigma researchers build forecasting and trading models by testing hypotheses on large, noisy datasets alongside engineers and data scientists, and they write production-quality code. Researchers are expected to stay connected to academia through reading groups, seminars and conferences, and more than half of employees come from outside finance.
Two Sigma hires Research Scientists across several research groups. Teams include:
- Quantitative research (machine learning): Adapting machine learning to many datasets to build trading models.
- AI research: Deep learning, language model and reinforcement learning ideas taken to production in alpha and trading-tactics models.
- Asset-class research groups: Macro, fixed income and credit, and ETF and passive-flow signal research.
- Data science: Finding signal in broad alternative datasets and turning it into investment insight.
Research Scientist experience and education requirements
The campus AI Research Scientist role requires a final-year STEM PhD, or a final-year master's plus work experience, strong Python (Rust, Java or C++ a plus), depth in PyTorch, JAX or TensorFlow, and deep learning, language model or reinforcement learning experience; NeurIPS, ICML or ICLR publications are preferred. Experienced quantitative research postings accept bachelor's through doctoral degrees in quantitative fields and ask for C, C++, Java or Python, applied machine learning on real data, and published work.
FAQs about the Two Sigma Research Scientist interview
How long does the Two Sigma Research Scientist interview process take?
Typically three to eight weeks from assessment to decision; rescheduled sessions, which have happened after technical problems on the firm's side, extend it.
What is the hardest round of the Two Sigma Research Scientist interview?
The statistics interview, because follow-ups continue until you run out of depth. The modeling case is the most underestimated: it feels like a discussion but is graded like an exam, and it decided at least one rejection after otherwise strong rounds.
Do I need a finance background?
No. The cases use bikes, weather and housing; finance appears mainly as framing, such as testing a momentum signal.
How much does a Two Sigma Research Scientist make?
Recent New York postings list base salaries of $200K to $220K for campus AI Research Scientists and $165K to $325K for experienced machine-learning quantitative researchers, plus a discretionary bonus that can be a large share of total pay.