Study
Statistics and Probability Questions: 227 Reported (2026)
TrueInterview
October 11, 2026 · 19 min read
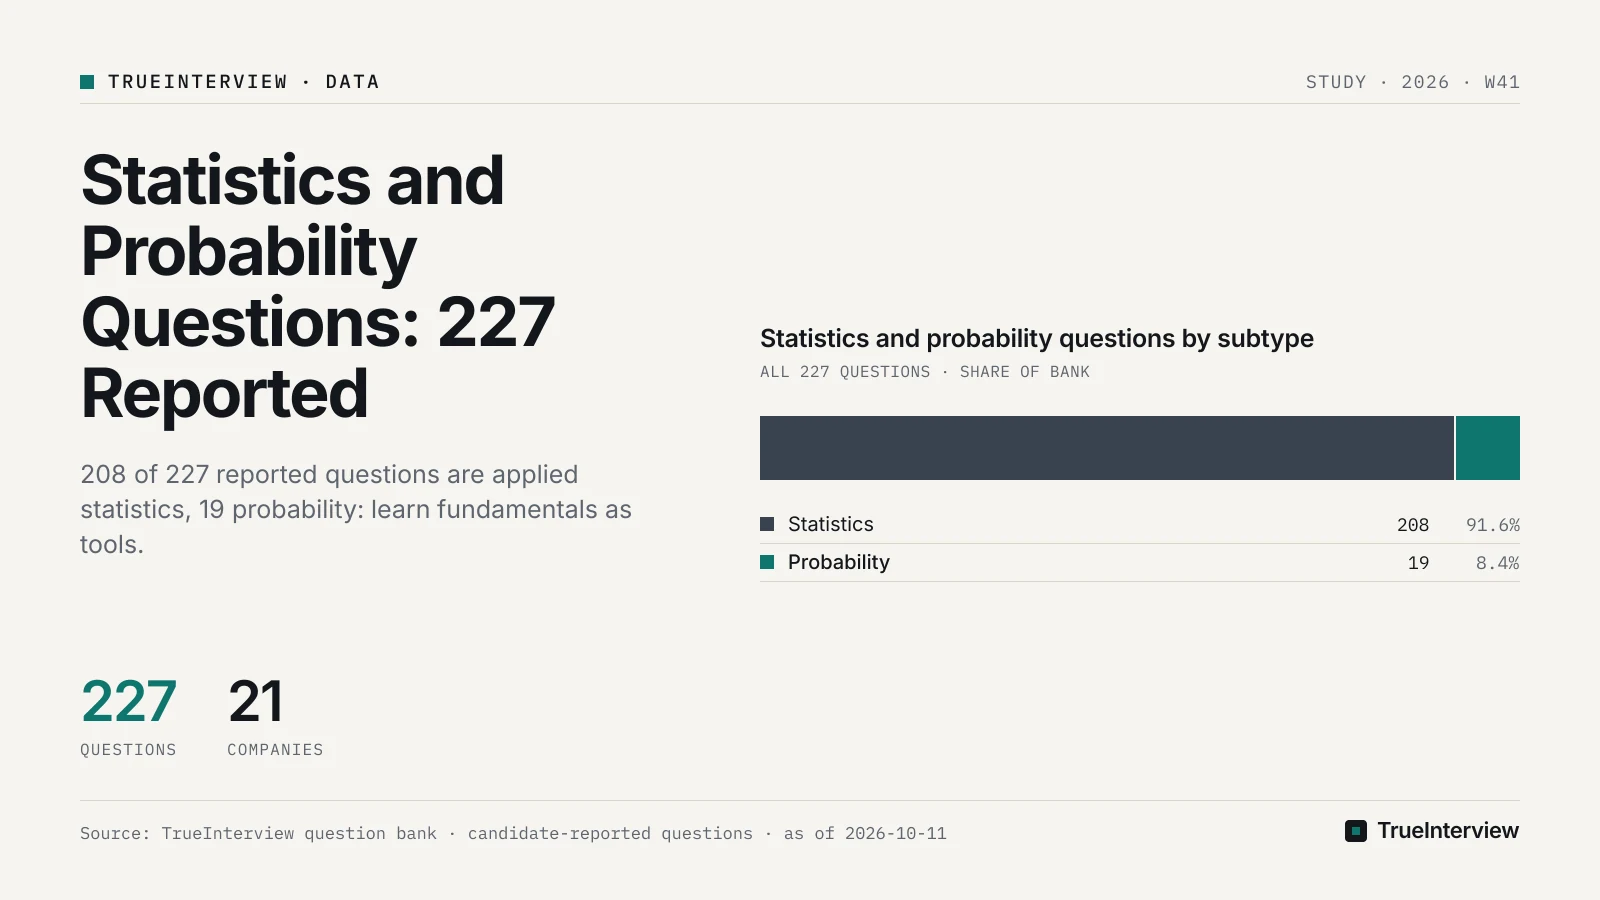
As of 2026-10-11, TrueInterview's bank holds 227 candidate-reported statistics and probability questions from 21 big-tech companies, and 208 of them are filed as statistics while 19 are filed as probability. Big tech tests distributions, inference, Bayes and expectation mostly inside applied product questions, with puzzles as a minority. Our take: learn each fundamental as a tool you can apply to a product number in two minutes and defend under a follow-up, then add a dedicated puzzle block only if your loop includes Meta, a quant-flavoured firm, or one of the companies whose probability titles appear below.
Disclosure: TrueInterview is an interview-preparation product and publishes this article. Facts about other products come from their public pages on the dates listed under Sources.
Which statistics and probability questions are candidates reporting?
Ten recent titles show the range, from OpenAI's restart-strategy question and LinkedIn's circle-sampling question to Coinbase's confidence interval and Meta's ads revenue estimate. Of the 227 questions, 55 were last reported in the 12 months before 2026-10-11, so those are the ones to practise first. The last column is our reading of the fundamental each title exercises, not a tag stored in the bank.
| Question | Company | Round | Last reported | Fundamental it exercises (our reading) |
|---|---|---|---|---|
| LLM Inference Timeout and Restart Strategy | OpenAI | Phone screen | 2026-05 | Expected completion time under a timeout |
| Commuter Coupon Conditional Probability | Lyft | Phone screen | 2026-05 | Conditional probability and Bayes |
| Sample uniformly from a circle's area | Onsite | 2026-02 | Change of variables, inverse-CDF sampling | |
| Answer core probability and statistics questions | Netflix | Onsite | 2026-03 | Mixed fundamentals under time pressure |
| Calculate a Confidence Interval | Coinbase | Onsite | 2026-02 | Standard error and interval interpretation |
| Measure Bird Species Segregation | Phone screen | 2026-05 | Turning a vague concept into a statistic with a baseline | |
| Evaluate ETA Impact on Conversion | Uber | Phone screen | 2026-02 | Regression on observational data, confounding |
| Estimate ads ranking revenue impact | Meta | Onsite | 2026-04 | Heavy-tailed metrics and variance |
| Diagnose Cold-Food Deliveries and Make a Launch Decision | DoorDash | Phone screen | 2026-05 | Decomposing a rate, effect size against noise |
| Walk through an A/B test end-to-end | Amazon | Phone screen | 2026-08 | Power, test choice and the interval |
Read the table by technique rather than by employer. LinkedIn's sampling question and OpenAI's restart question come from different companies and rounds, yet both reward the same habit: write the distribution down before you compute anything.
LLM Inference Timeout and Restart Strategy (OpenAI)
This title is linked from 4 candidate interview write-ups, all at OpenAI, so there is more than one account of it to study. The title points at an expected-time problem, in our reading: a request that may hang, a timeout, and a fresh attempt. Model each attempt as independent, then the expected completion time with timeout τ is the cost of failed attempts plus the conditional time of the successful one.
p      = P(T ≤ τ)
E[time] = E[T | T ≤ τ] + τ · (1 − p) / p
The decision to prepare, in our view, is when restarting helps at all. If latency is exponential, the memoryless property makes every timeout useless, because a request that has waited is no worse off than a fresh one. Restarts pay only when the latency distribution has a heavy tail or a hung mode, and at senior level you should add the cost the formula leaves out: a restart duplicates GPU work and adds load at exactly the moment the system is slow.
Sample uniformly from a circle's area (LinkedIn)
Drawing the radius uniformly is the trap: area grows with the square of the radius, so uniform radii pile points near the centre. Invert the radius CDF instead.
θ ~ Uniform(0, 2π)
r = R · sqrt(U),   U ~ Uniform(0, 1)     because P(radius ≤ r) = (r / R)²
Rejection sampling from the bounding square is the alternative and keeps a little over three quarters of draws. Offer both, then say which you would ship: the inverse-CDF version has no loop and a fixed cost per sample.
Calculate a Confidence Interval (Coinbase)
The arithmetic is short; in our view, the interpretation is where answers separate. Final Round AI's guide lists "Confidence intervals and what they actually measure" as a core topic. Say it precisely: the procedure captures the true value in the stated share of repeated samples, which is different from a probability that this particular interval contains it.
proportion:  p̂ ± z · sqrt(p̂ (1 − p̂) / n)
mean:        x̄ ± t(n−1) · s / sqrt(n)
The senior follow-up is which variance belongs in that formula. If the metric is a ratio such as revenue per session but users were the sampled unit, sessions from one user are correlated, so use the delta method or a user-level bootstrap rather than treating sessions as independent.
Measure Bird Species Segregation (Google)
We have the title, not a transcript, so treat it as an open measurement prompt; what follows is our reconstruction. Define a statistic for how separated two groups are, then compare it with what random placement would produce. A same-species nearest-neighbour share, tested against a permutation baseline that shuffles species labels, is one defensible answer. In our view, the part to prepare is the null: what no segregation would look like and how you would simulate it.
Is the round mostly puzzles or applied inference?
Mostly applied inference. The 208-to-19 split barely moves by round: 113 of 123 phone-screen questions and 93 of 102 onsite questions are statistics, and only 2 questions are tagged as online assessments. Because the subtype mix is nearly the same in screens and onsites, prepare one set of fundamentals for both; in our view, the depth of the follow-ups is where the rounds differ.
Read the statistics label as applied statistics. In our reading it spans inference titles such as Coinbase's interval and Netflix's core-fundamentals question as well as product-measurement prompts, so most of it is statistics in service of a product decision. A/B test design has its own walkthrough; this guide stays on the statistics underneath it.
| Company | Questions | Statistics | Probability | Where to spend fundamentals time (our view) |
|---|---|---|---|---|
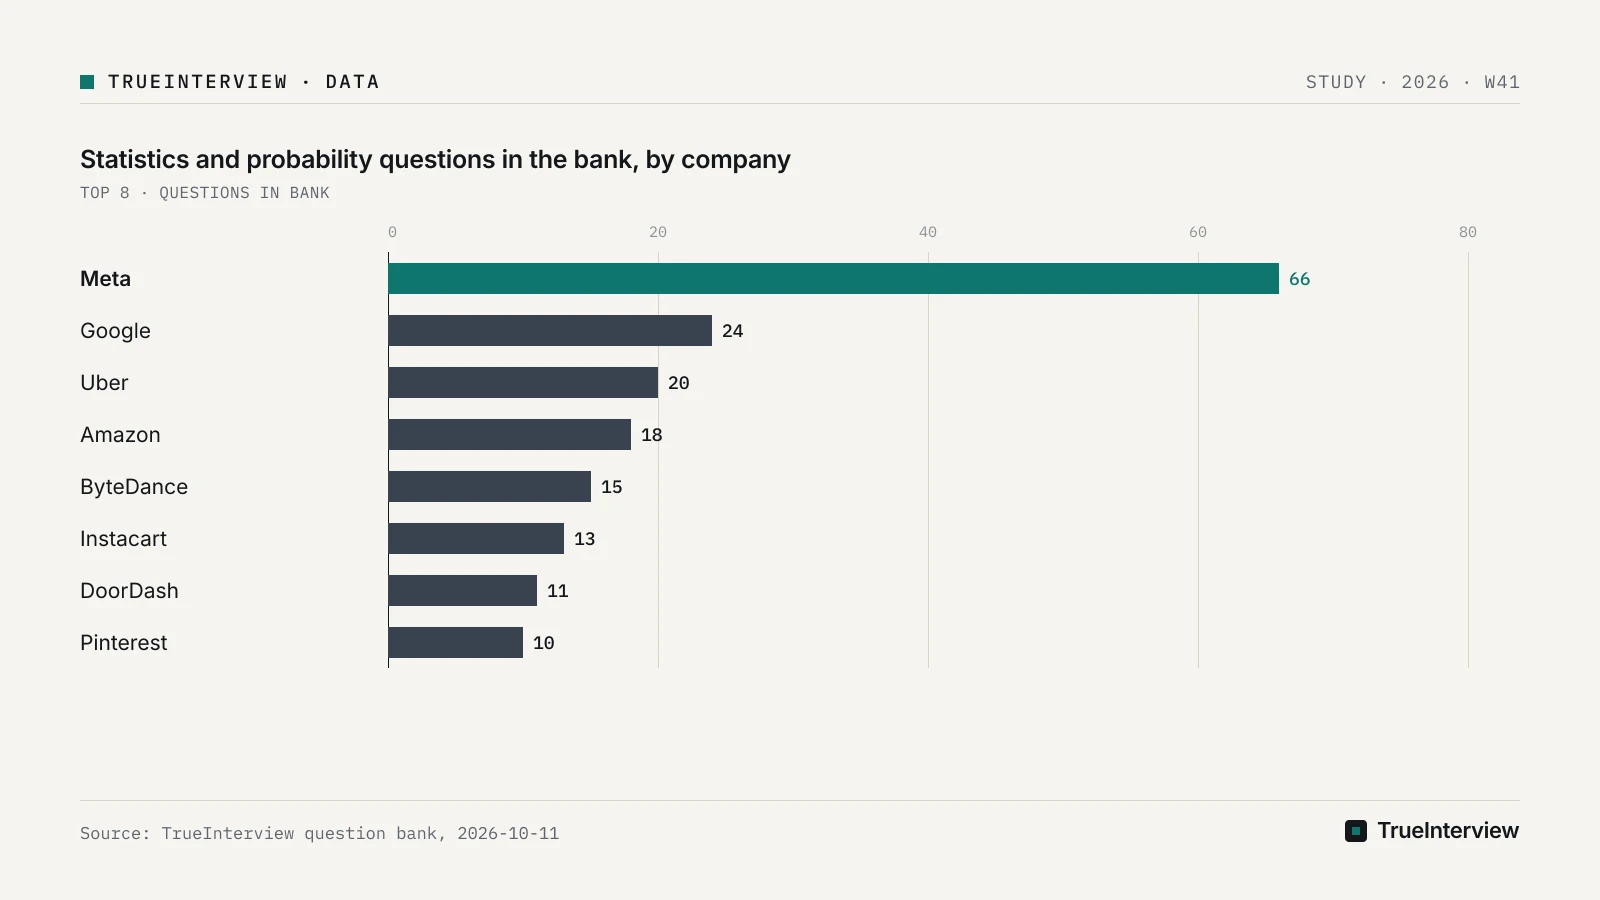
| Meta | 66 | 58 | 8 | Keep a puzzle block; drill heavy-tailed revenue metrics |
| 24 | 24 | 0 | Validity of the comparison, intervals | |
| Uber | 20 | 20 | 0 | Regression on observational data |
| Amazon | 18 | 18 | 0 | Power and intervals |
| ByteDance | 15 | 15 | 0 | Inference on rates |
| Instacart, DoorDash, Pinterest, Coinbase, Stripe | 13, 11, 10, 8, 6 | Not broken out | Not broken out | Rates, intervals, variance |
Our take: generic prep lists lead with dice and coins because puzzles are easy to write down. The reported mix says the opposite for most loops: at Google, Uber, Amazon and ByteDance the bank shows no probability questions at all, so a week of puzzles there buys little. Meta is the one large set where a probability block earns its hours, and the counts measure what candidates reported, not how often each company asks.
Which inference fundamentals carry the applied questions?
Four ideas carry most follow-ups: what a p-value is, what drives sample size, how the central limit theorem justifies the test, and the gap between a significant result and a useful one. Let's Data Science's guide gives the definition to use: "A p-value is the probability of observing results at least as extreme as what you measured, assuming the null hypothesis is true."
The same guide calls the answer "It is the probability that the null hypothesis is true" one of the most persistent misconceptions in statistics. A post on sirjohnnymai.com about Netflix experimentation interviews adds that debriefs penalise any answer treating a p-value as a binary pass or fail. Practise saying the definition, then immediately what it does not tell you: the size of the effect, or the probability the feature works.
Sample size follows from four inputs that Let's Data Science's guide lists: baseline rate, minimum detectable effect, significance level and power. The guide calls α = 0.05 and power of 0.80 "conventions, not laws". The formula for two equal arms comparing means is worth knowing by heart:
n per arm ≈ 2 · (z_{1−α/2} + z_{1−β})² · σ² / δ²
At the usual conventions this collapses to Lehr's rule of thumb: about sixteen times the variance divided by the squared effect, per arm. The consequence interviewers probe is the square: halving the effect you want to detect quadruples the sample.
The central limit theorem is about the sampling distribution of the mean, not the shape of the raw data. Final Round AI's guide lists it alongside "why it matters for A/B test interpretation". Heavy-tailed metrics such as revenue per user converge slowly, which is why Meta's ads revenue question is a variance question as much as a revenue question: name capping, a log transform with its interpretation cost, or a bootstrap before the interviewer asks.
Our take: significance versus size is where these answers usually fail. Final Round AI's guide says "Candidates who cannot distinguish statistical significance from practical significance fail this type of question consistently." Pair every p-value with an effect size and an interval, and state the smallest effect that would change the decision before you look at the result.
Which distributions should you know cold?
Six, well enough to choose between them out loud. Final Round AI's guide lists "Probability distributions: normal, binomial, Poisson, and when to use each", and the "when" is the part a follow-up tests. The table pairs each distribution with the property that gets probed and a place it appears in the reported titles.
| Distribution | Use it for | The property to state | Where it shows up (our reading) |
|---|---|---|---|
| Bernoulli and binomial | Conversions, click-through, coupon redemption | Variance is largest when the rate is near one half | Uber's ETA and conversion, Lyft's coupon |
| Poisson | Counts per interval: orders per hour, errors per request | Mean equals variance; when variance is larger, switch to negative binomial | Delivery and ads volume metrics |
| Geometric | Attempts until the first success | Memoryless in discrete time | Retries and restarts |
| Exponential | Waiting time between events | Memoryless; the minimum of independent exponentials is exponential with the rates summed | OpenAI's restart question |
| Normal | Sample means and differences of means | Arrives through the central limit theorem, not through the data | Every interval and test |
| Uniform | Sampling, order statistics | GitHub's statistics bank asks for the best estimate of d from n draws on [0, d]: the sample maximum, biased low, so scale it by (n + 1) / n | LinkedIn's circle sampling |
Two habits help in every distribution follow-up. Say the support and the parameter before naming a formula, and check the mean-variance relationship against the data you are told about. A count metric whose variance far exceeds its mean is telling you Poisson is the wrong model.
How do you work the probability and expectation puzzles?
As a short list of techniques, not a pile of problems. Let's Data Science's guide warns that "Probability questions at the start of a statistics screen are not warm-up softball." Most reported puzzles reduce to Bayes with an explicit base rate, getting the conditioning event right, first-step analysis, symmetry, and an expected-value decision.
| Technique | Reported example and source | The move | The trap |
|---|---|---|---|
| Bayes with a base rate | Spam filter, Let's Data Science's guide | Prior times likelihood for each hypothesis, then normalise | Ignoring the base rate |
| Conditioning direction | Two trips, one international in December, reported in one candidate's SIG write-up on hacktherounds.com | Condition on at least one trip having the property | Treating the detail as naming a specific trip |
| First-step analysis | Die with one optional reroll, Let's Data Science's guide | Compare the value in hand with the value of continuing | Averaging over the wrong decision |
| States for patterns | Penney's game, HHT against HTH, reported in the same hacktherounds.com write-up | States for partial patterns, then first-step equations | Assuming equal-length patterns tie |
| Symmetry | Three points on a circle forming an obtuse triangle, reported in the same hacktherounds.com write-up | Find the symmetric event that is easy to count | Integrating when a symmetry argument is shorter |
| Expected-value decision | Poker call after a raise, reported in the same hacktherounds.com write-up | Compare the call with the pot it wins | Counting money already committed |
The worked answers are short, which is why speed matters. In the spam example in Let's Data Science's guide, a 30% base rate, a 95% true positive rate and a 2% false positive rate give 0.285 / (0.285 + 0.014), about 95%. Let's Data Science's guide adds that with a 1% base rate the same filter's flag is right only about a third of the time, the base-rate fallacy that "trips up candidates every time".
The double-headed coin works the same way. In the reported question with 99 fair coins and one double-headed coin, seven heads multiply prior odds of 1 to 99 by a likelihood ratio of 128, so the posterior is 128 / 227, about 56%. Writing odds instead of probabilities keeps that calculation to one line.
For the die question in Let's Data Science's guide, reroll when the first roll is 1, 2 or 3, since a fresh roll is worth 3.5 on average; the game is then worth 4.25. In the reported Penney's game, HHT wins with probability 2/3: once HH appears HHT must arrive first, while a tail after HT sends HTH back to the start. For the reported triangle question, three uniform points form an acute triangle only when the centre lies inside it, which happens with probability 1/4, so the obtuse answer is 3/4. In the reported poker hand, you call $20 into a pot that will hold $60, so you need to win at least a third of the time.
The SIG write-up on Hack The Rounds is one candidate's report, and it names the traps worth rehearsing. It says misreading the December detail as fixing which trip was international breaks the conditioning direction, and that graders listen for "the $10 blind is sunk, only the $20 call is relevant" said out loud. The write-up describes the phone screen as roughly twelve problems in an hour, moving on as soon as an answer came with a justification.
Our take: if your loop is quant-flavoured, that pace is the bar. The same candidate's account asks for "a clean derivation under 90 seconds for every problem in the canonical pool", and DataScienceHired's 2026 report lists statistics as Two Sigma's top topic, 10 of its 25 questions. For a big-tech data science loop, an hour a week of these is enough; the applied follow-ups decide more rounds.
How should you read a regression in an interview?
As a statement about conditional averages, followed by the assumption the conclusion depends on. Final Round AI's guide lists "Regression fundamentals: linear regression assumptions, multicollinearity, heteroscedasticity". In our reading, Uber's ETA and conversion question is the kind of prompt where those ideas get used on observational data, so practise interpretation before derivation.
- Coefficient. The expected change in the outcome per unit change in the predictor, holding the other included predictors fixed. It is causal only if the predictor was randomised or every confounder is in the model.
- Logs. With a logged outcome, a coefficient is approximately a proportional change for small values; with both sides logged, it is an elasticity.
- Logistic regression. A coefficient is a change in log-odds; exponentiate it for an odds ratio, and do not read an odds ratio as a risk ratio when the outcome is common.
- Multicollinearity. It inflates standard errors and makes individual coefficients unstable, but it does not bias predictions. Check variance inflation factors before dropping variables.
- Heteroscedasticity. Ordinary least squares stays unbiased, but its standard errors are wrong. Use heteroscedasticity-consistent (sandwich) errors, and cluster them when rows from one user are correlated.
- Omitted variables. The bias takes the sign of the omitted variable's effect times its correlation with the included predictor. For ETA and conversion, name plausible confounders such as trip length or demand peaks, explain how each could move both the ETA and the booking decision, and say how you would check, for example by comparing riders within the same time window and distance band.
An article on interview101.com puts the expectation plainly: "your job is to identify which assumptions matter and adjust accordingly." When you finish reading a coefficient aloud, name the one assumption that would overturn it and how you would check it.
Are generic PDF and GitHub question lists enough?
For definitions, yes; for deciding what to drill first, no. The GitHub statistics bank that ranks for these searches asks you to explain the central limit theorem and to compare chi-square, ANOVA and the t-test. GeeksforGeeks' list asks for definitions of variance, the p-value and the confidence interval. Neither attaches a company, a round or a month.
Some of those items still make good warm-ups when you add the arithmetic. GitHub's bank asks for the null hypothesis and p-value after 10 coin flips show one head. For GitHub's coin question, one head or fewer has probability 11/1024 under a fair coin, so the two-sided p-value is 22/1024, about 0.02. Saying both numbers and why you doubled is the version an interviewer remembers.
Our take: spend one evening on a generic list as flashcards and skip the rest. Its job is to catch a definition you have forgotten. The hours belong to the reported titles above, where the question comes with a company, a round and a follow-up.
What changes at senior and staff level?
Our data has no senior-versus-junior split for this topic's write-ups, so the level guidance here is our view, anchored on published descriptions. The Unofficial Google Data Science blog describes an internal expectation that statistical knowledge rises from proficient for recent PhD hires to advanced and then expert at higher levels. The bar moves from knowing the method to knowing where it breaks.
The interview101.com article says candidates who completed Google data science loops in 2023 and 2024 reported statistics rounds built around edge cases where the obvious analysis breaks down. The same article says the interviewer is "measuring whether you recognize when a comparison is invalid". The sirjohnnymai.com post says interviewers expect a discussion of statistical power, prior probability and business impact rather than a significant-or-not label.
| Topic | Junior or new grad | Senior | Staff |
|---|---|---|---|
| p-value | Correct definition | Definition plus what it cannot tell you | Ties the threshold to the cost of a wrong launch |
| Interval | Correct formula | The right variance for the unit of analysis | Chooses the interval the decision needs |
| Distribution | Names the family | Checks the mean-variance relationship | Says when the model is wrong and what replaces it |
| Puzzle | Correct answer | Answer plus a sanity check | Answer, check, and the general technique |
| Regression | Reads a coefficient | Names the confounder | Proposes the design that removes it |
Our take: at senior level, stop collecting harder questions and raise the bar on the same ones. The sirjohnnymai.com post warns that spending more than 10 minutes on a pure derivation risks running out of time for product judgement. Derive quickly, then spend the time on the assumption that would change the answer.
Which rounds decide whether you are down-leveled?
Our take: the level is set by the follow-ups, not the opening answer. A correct p-value definition clears the floor in any round; the level signal comes when the interviewer breaks an assumption, such as correlated users, a heavy tail or a confounder, and from the project deep dive where you defend an analysis you shipped.
Final Round AI's guide says "the majority of data science interview rejections at Google, Meta, and Amazon do not happen in the machine learning round" and places them in SQL and statistics instead. The authors of the Unofficial Google Data Science blog post, who say they have conducted over 600 interviews at Google, write that with multiple-choice questions "we cannot see how a person thinks". That is the signal a live round exists to collect, so think aloud.
If you are interviewing at senior or staff level, prepare one past analysis where an assumption failed and you changed the method. The interview101.com article says Google's statistics rounds go deeper on experimental validity and causal reasoning than Meta's, which candidates describe as including more SQL optimisation and ML model implementation. Ask your recruiter which round carries the statistics depth and treat it as the level round.
How we counted
Counts come from TrueInterview's question bank as of the date above, filtered to the statistics and probability subtypes across 21 big-tech companies. They are candidate-reported questions reconstructed for practice, not any company's official question list. TrueInterview says each report is dated wherever the report gave a month and checked against other reports of the same round. A question can count in more than one round, so round totals overlap, and the technique column is our reading of each title rather than a stored field.
FAQ
Is there a PDF of statistics interview questions worth using?
The lists that rank for PDF searches are definition banks: the GitHub page and GeeksforGeeks cover the central limit theorem, hypothesis tests and intervals without saying where or when anyone was asked. Use one as a flashcard pass to find gaps in your definitions, then move to dated, company-filed questions. A list without a round or a month cannot tell you whether you are rehearsing something live or something years old.
Are probability brainteasers still asked at big tech?
Yes, but as a minority, and concentrated. In our bank, Meta accounts for 8 of the 19 probability questions, and the rest sits at companies outside the four large all-experiment sets, with titles such as Lyft's coupon question. DataScienceHired's 2026 report lists statistics as Netflix's top topic, 8 of its 41 questions. If your loop is at a quant firm, prepare for a dedicated puzzle round like the SIG screen described above; for most big-tech data science loops in our bank, probability questions are a minority, so treat them as one block of your preparation rather than the centre of it.
How much math do I need for a statistics round?
Enough to derive the standard results by hand quickly: Bayes' rule, expectations of the common distributions, the standard error of a mean and a proportion, and the sample-size formula. One author wrote in a Medium article that you should practise by hand because many interviews are offline. Proofs are rarely the point; a clean derivation followed by the assumption it depends on is.
Do ML engineers get these questions too?
The bank does not split these questions by role, so plan from the role description: if your ML role touches evaluation or online experiments, the same inference fundamentals apply. DataScienceHired's report says LLM questions are now tied for the second-largest topic at 35 questions, on par with statistics. For an ML engineer, the statistics that matter most are evaluation intervals, variance of metrics and the restart and latency reasoning in OpenAI's reported question, so weight those above textbook distribution trivia.
Should I learn Bayesian or frequentist methods?
Both interpretations, and the ability to switch. Final Round AI's guide lists "Bayesian probability and Bayes' theorem applied to real product scenarios" as a core topic. Know that a confidence interval describes a procedure while a credible interval is a probability statement given a prior, and be ready to explain when a prior helps, such as a launch with little data and strong history.
Your practice plan
The target is narrower than a statistics syllabus: a handful of inference ideas, six distributions, a short list of puzzle techniques, and the recent titles. This plan assumes four or five evenings a week for three weeks while you work full time.
- Week one, first evenings: write the p-value, interval and sample-size explanations from memory, then work Calculate a Confidence Interval aloud, naming the variance you would use and why.
- Week one, remaining evenings: work Estimate ads ranking revenue impact and Evaluate ETA Impact on Conversion, stating the heavy-tail fix for the first and the confounders for the second before computing anything.
- Week two: run the puzzle techniques table on a timer, then solve Commuter Coupon Conditional Probability and Sample uniformly from a circle's area, writing the conditioning event or the CDF first.
- Week two, if OpenAI or an ML-infrastructure team is in your loop: work LLM Inference Timeout and Restart Strategy and argue when a restart helps and what it costs the serving system.
- Week two, if you are senior or staff: rewrite your week-one answers at the senior column of the level table, adding the assumption that would overturn each conclusion.
- Week three: open your target company's questions in TrueInterview's question bank, where TrueInterview says reports are dated and recent, often-reported questions come first; at Meta keep the puzzle block, elsewhere put those evenings into applied inference.
- Last evenings: run Answer core probability and statistics questions and Measure Bird Species Segregation as full mocks, and record one to check that every number you say comes with its assumption.
Sources
- TrueInterview question bank — statistics and probability at big-tech companies — counted 2026-10-11
- Data Science Interview Preparation Guide | Final Round AI — checked 2026-10-11
- Statistics and Hypothesis Testing Interview Questions for Data Scientists | Let's Data Science — checked 2026-10-11
- P-Value Misinterpretation in Netflix DS Experimentation Interview: A Common Pitfall | Johnny Mai — checked 2026-10-11
- Data-Science-Interview-Questions-Answers/Statistics Interview Questions & Answers for Data Scientists.md at main · youssefHosni/Data-Science-Interview-Questions-Answers · GitHub — checked 2026-10-11
- SIG Quant Research Phone Interview Experience (2026) - Probability Drill with Penney's Game, Bayes & Three Points on a Circle, Pending | HackTheRounds — checked 2026-10-11
- The State of Data Science Interviews (2026): What 389 Real Questions Reveal About What Companies Actually Test | DataScienceHired Blog — checked 2026-10-11
- Google Data Scientist Interviews Evaluate Statistical Rigor Differently Than They Did in 2021 — checked 2026-10-11
- Statistics Interview Questions and Answers - GeeksforGeeks — checked 2026-10-11
- Quantifying the statistical skills needed to be a Google Data Scientist — checked 2026-10-11
- Interview prep compared: your application, end to end · TrueInterview — checked 2026-10-11
- Medium — checked 2026-10-11
- Real FAANG Interview Questions by Company · TrueInterview — checked 2026-10-11
Last reviewed: 2026-10-11.