Study
Metrics and Logging System Design: The Decisions to Prepare
TrueInterview
October 18, 2026 · 15 min read
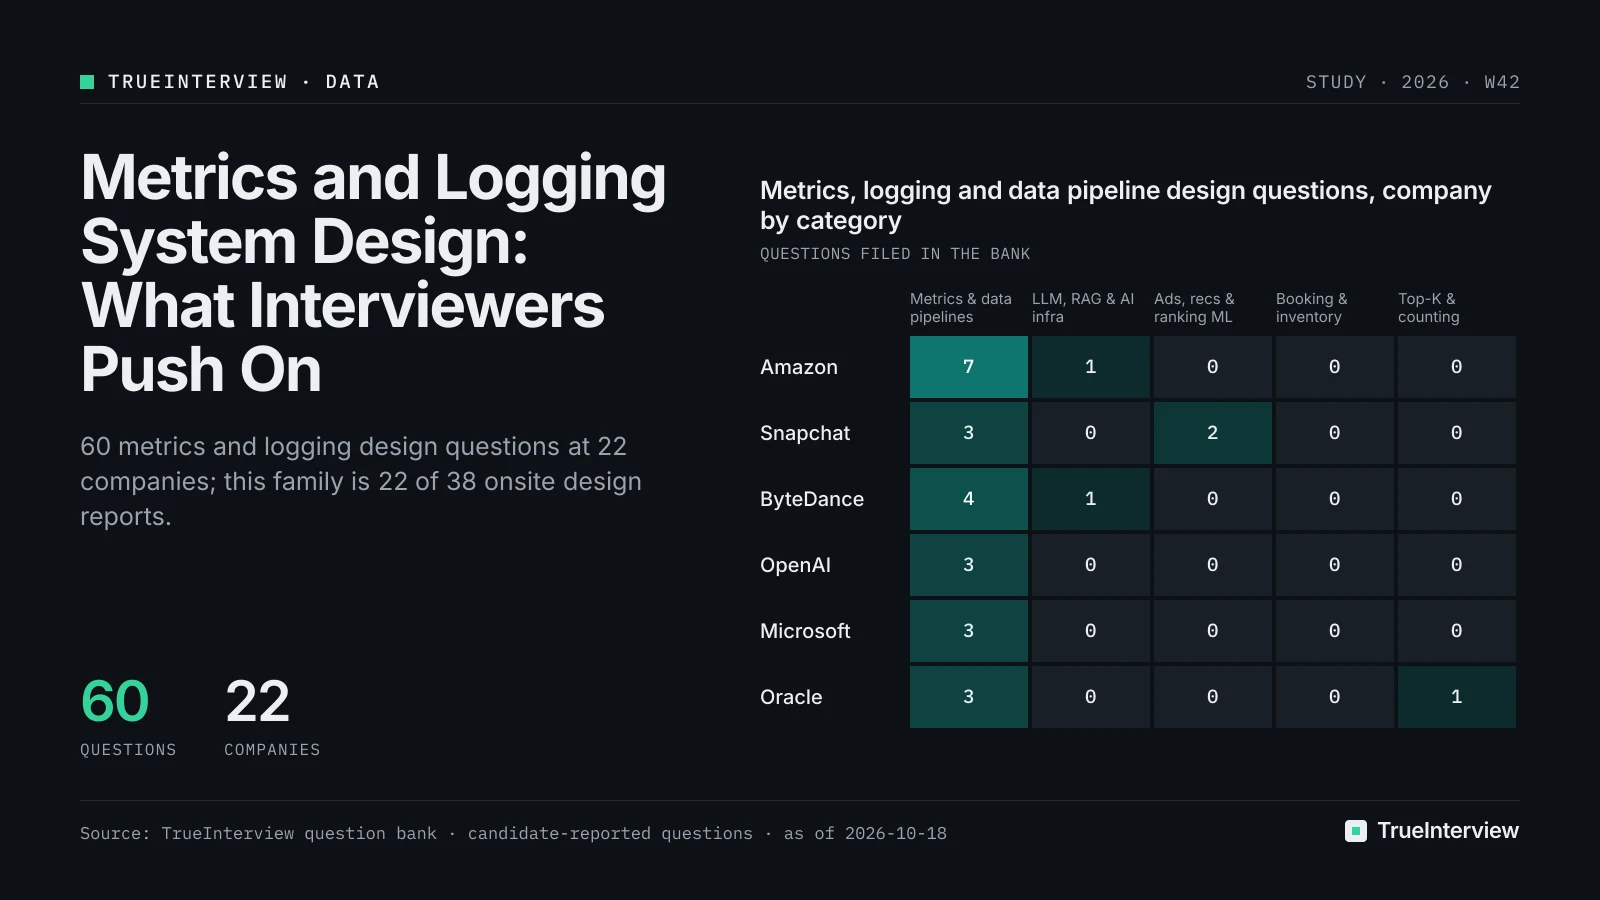
As of 2026-10-18, TrueInterview's bank holds 60 candidate-reported metrics, logging and data-pipeline design questions from 22 big-tech companies, and 52 of them were last reported within the past 12 months. Write-ups linking them come mostly from candidates who reported a senior-or-above level (56 links vs 15 from junior-or-below), which in our view may partly reflect who writes reports. Our take, in line with PracHub's framing of the metrics-ingestion interview: the round rewards cutting an enormous write volume while keeping the numbers correct, through series identity, cardinality limits, mergeable aggregates and idempotent ingestion. Naming Kafka, Elasticsearch and Glacier in the right order earns very little on its own.
Disclosure: TrueInterview is an interview-preparation product and publishes this article. Facts about other products come from their public pages on the dates listed under Sources.
The decisions this article asks you to prepare are TrueInterview's expectations built from PracHub, Prometheus, OpenTelemetry and Google SRE guidance, not reported interviewer follow-ups.
Where do metrics and logging design questions show up?
Mostly in onsite rounds. Of the 60 questions, 38 were reported in onsites, 24 in phone screens and one in an online assessment, and one question can appear in several rounds. Within the onsite design reports, this family accounts for 22 of 38, more than any other design family. If you are in a senior onsite loop, rehearse one telemetry design through storage, overload and alerting, not just the write path.
The phone screen still matters. Among the 24 design questions reported for phone screens, 9 fall in the metrics, logging and pipelines family. If your next step is a screen, rehearse a half-hour cut of the same design that covers the data model and the write path, and leave storage tiers for the onsite.
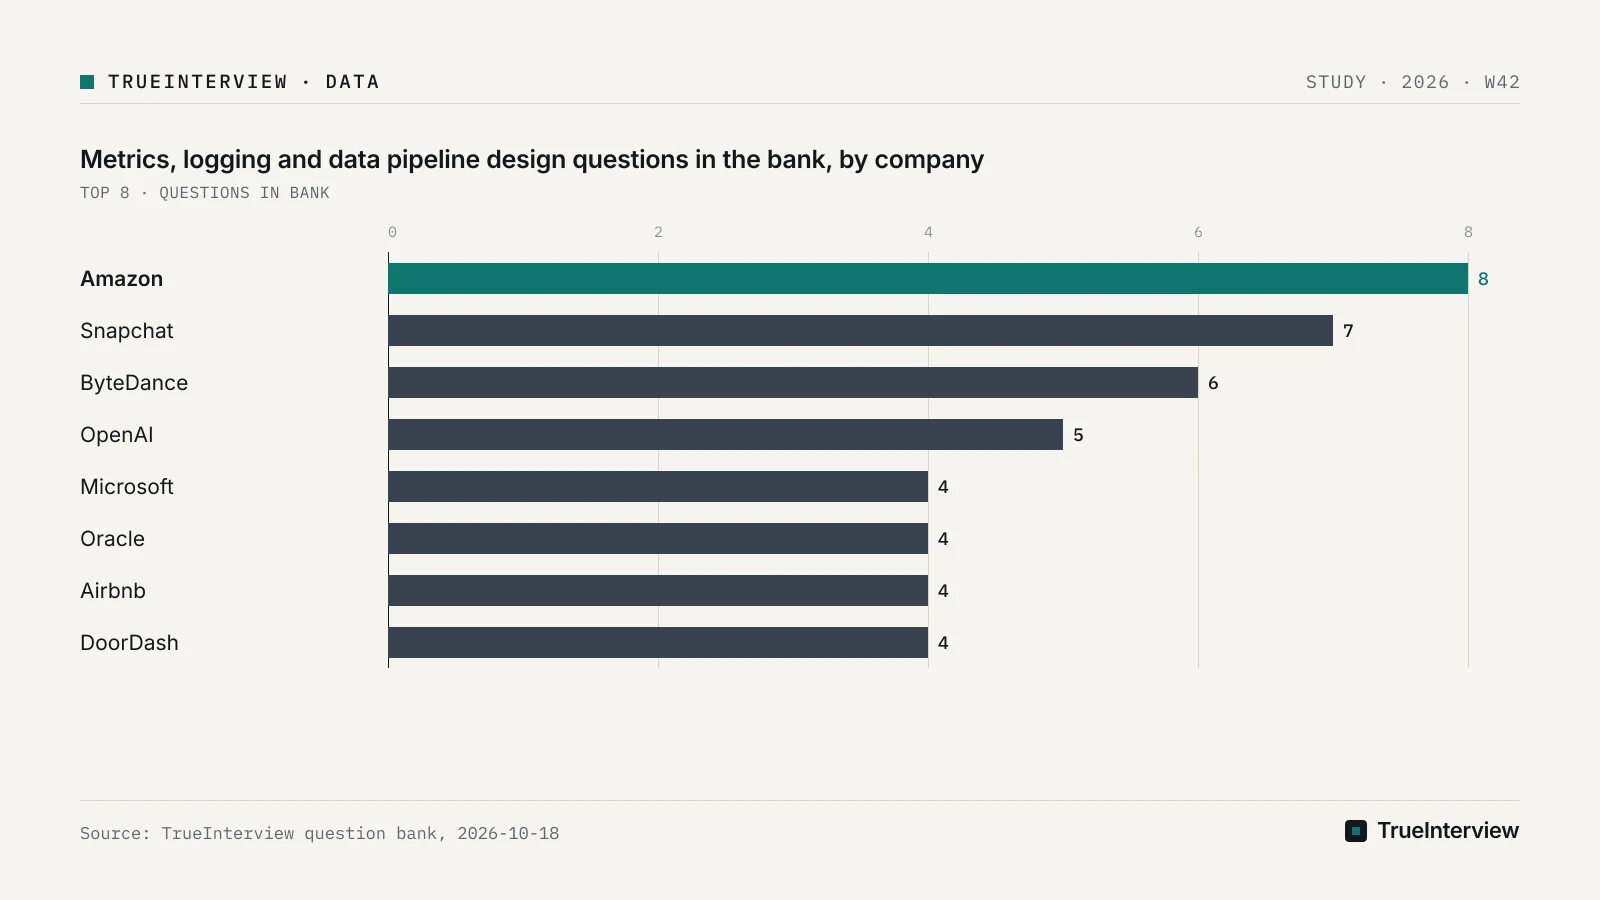
The company spread is wide, and the dated examples show what each company's prompt looks like:
| Company | Questions in this set | In the core metrics and logging family | Dated example (round, last reported) |
|---|---|---|---|
| Amazon | 8 | 7 | Design Metrics System (onsite, 2026-07) |
| Snapchat | 7 | 3, plus 2 ads and ranking | Design a News Aggregation Feed (phone screen, 2026-06) |
| ByteDance | 6 | 4 | Not in our dated sample |
| OpenAI | 5 | 3 | Real-Time Electricity Monitoring and Policy Control (phone screen, 2026-09) |
| Oracle | 4 | 3, plus 1 top-K | Event Ingestion + Top-K Aggregation (onsite, 2026-09) |
| Microsoft | 4 | 3 | Not in our dated sample |
| DoorDash | 4 | Not split | Design an alert notification system (onsite, 2026-08) |
| Airbnb | 4 | Not split | Host Listings Page — Aggregation Optimization (onsite, 2026-01) |
| 3 | Not split | Metrics & Monitoring Platform (onsite, 2026-03) | |
| Apple | 3 | Not split | Ads Click Aggregator (phone screen, 2026-04) |
Most of these are distributed-systems prompts: 46 of the 60 carry that subtype, with small experiment-design, ML-design, frontend and low-level-design groups behind them. Amazon is the clearest case, with nearly all of its questions in the core family. For an Amazon, LinkedIn or DoorDash loop, a telemetry platform design is the one to have rehearsed end to end.
Which prompt families are reported, and what does each force you to decide?
They are several prompts, each with its own first decision. By title, 31 of the 60 questions sit in the core metrics, logging and pipelines family, 5 in LLM and AI infrastructure, 4 in ads and ranking, and 3 in top-K counting. A candidate who answers every one of them with the same log-aggregation diagram misses the decision each prompt is built around.
| Family | Reported titles (company) | The decision we expect to be pressed on (our take) |
|---|---|---|
| Core metrics and monitoring | Design Metrics System (Amazon, DoorDash); Metrics & Monitoring Platform (LinkedIn); VM Health Monitoring at 1M Scale (Oracle) | What a series is, how many you allow, and which rollups stay mergeable |
| Ad-click and ad-event aggregation | Design Ad Click Event Aggregation System (Pinterest, Airbnb); Ads Click Aggregator (Apple); Design an Ad Event Aggregator (Netflix, Apple) | Deduplication by event ID, windowing and late events |
| Top-K and counting | Event Ingestion + Top-K Aggregation (Oracle); Track Top-K Frequent Elements from an Unbounded Stream (Salesforce); Metric Counter Library (Stripe) | Exact versus approximate counts over a stream, and where partial counts merge |
| LLM and AI telemetry | Telemetry Collector and GPU Utilization Dashboard (NVIDIA); Design an Analytics Metrics Dashboard for ChatGPT / LLM Service (Salesforce) | Which per-request dimensions become labels and which stay in logs |
The most-linked prompts tell you where to start. Design Metrics System is linked from 10 candidate write-ups at LinkedIn, Snapchat, Amazon, DoorDash and Stripe, and it is filed under 6 companies in the bank. Snapchat's Design a News Aggregation Feed has 7 write-ups and Databricks' Design Book Price Aggregator has 6. Design Ad Click Event Aggregation System has 4 write-ups from Pinterest and Meta and is filed under 5 companies.
Our take: the news feed and the book price aggregator are content-aggregation problems, where fetching, merging and freshness matter more than telemetry volume. Practise them if Snapchat or Databricks is on your list. For everyone else, the metrics platform and the ad-click aggregator cover most of the family.
One more variant can change the shape of the answer. The Cross-Platform Logging Library is filed under 5 companies. Hello Interview's community page lists a logger system that prints a message only if it has not been printed in the last 10 seconds, with support for multiple applications and search. Our take: by their titles, these start from a component's API and suppression logic rather than a fleet-wide pipeline, so ask whether the interviewer wants the library or the platform before you draw a cluster.
What should you define before you draw the pipeline?
Define the series and its budget first. PracHub's guide recommends a series key of tenant, metric name, resource identity, attribute set and aggregation semantics, and it says to bound active-series cardinality per tenant and per metric. Our take: because each label combination adds stored data, cardinality is where we would expect the deepest senior follow-ups, ahead of any question about Kafka.
The reason is arithmetic. Prometheus's naming guide says "every unique combination of key-value label pairs represents a new time series". The same guide says not to use labels for high-cardinality dimensions such as user IDs, email addresses or other unbounded sets of values. Say which labels you would refuse, and where those dimensions go instead: request logs or traces, sampled, with their own retention.
OpenTelemetry's data model gives you the vocabulary for the fix. It describes spatial reaggregation, which turns metrics with unwanted attributes into metrics with fewer attributes, and temporal reaggregation, which rolls high-frequency data into longer intervals. It also says reporting every raw event straight to a backend "would be infeasible due to the sheer volume of data". PracHub's guide frames the whole interview the same way: it "tests whether you can preserve meaning while reducing enormous write volume".
Naming hygiene is part of the contract. Prometheus says a metric name must refer to a single unit and a single quantity, and recommends base units such as seconds and bytes. Its guide adds a test: sum() or avg() over all of a metric's dimensions should be meaningful, and "If it is not meaningful, split the data up into multiple metrics."
Our take: open with the series key and a per-tenant cap, then name one label you refuse. That takes two minutes and answers the follow-up most candidates meet unprepared.
How do you keep aggregates correct after you shrink them?
Keep only state that merges. PracHub's guide says downsampling should retain counter sums, gauge min/max/sum/count and mergeable histogram state rather than only averages, and that averaging precomputed percentiles is generally not a valid way to recover a global percentile. Say the percentile point out loud; it separates a prepared answer from a tool checklist.
Histograms are the mechanism. OpenTelemetry's data model describes a histogram as a metric whose raw events are recorded in a compressed format rather than as individual time series. Bucketed or sketch-based state can be added across hosts and time windows, and a stored percentile cannot. If the interviewer asks for a fleet-wide tail latency, you merge the histograms and then compute the percentile.
Temporality is the second decision. OpenTelemetry's documentation says delta temporality allows a stateless collector while cumulative temporality needs a stateful one. It also says deltas unburden the client from keeping high-cardinality state. PracHub's guide adds the cost of aggregating in the client: it reduces bandwidth but loses raw dimensions and trusts heterogeneous SDK behavior.
Our take: for a multi-tenant platform with many client SDKs, take deltas from clients and keep the stateful work on the server, partitioned by series. Pick cumulative only when you control the clients and need to survive dropped reports without gaps.
What does an ingest acknowledgment promise?
An acknowledgment is a contract, and we would expect to be asked what yours means; the bank holds no reported follow-ups for these prompts, so treat this as our view. PracHub's guide says acknowledgment semantics must specify whether a 200 means validated, durably queued or stored in the final database. For a high-volume telemetry pipeline, choose durably queued and say so before you are asked.
Then make the write path survive replays. PracHub's guide warns against claiming exactly-once semantics from HTTP. Its guide says to partition the log by a stable series hash, so ordering and stateful delta conversion stay local, and to checkpoint consumer offsets only after idempotent storage writes commit. According to bugfree.ai's Medium post, duplicates can be discarded by unique IDs or timestamps, and processed records can carry markers to prevent double-processing. That is one author's checklist; in your design, name the ID you deduplicate on and the store that remembers it.
Rehearse one follow-up until it is automatic: the consumer crashes after writing but before checkpointing. The offset was not saved, so the batch is replayed, and the idempotent write absorbs it. If your storage write is not idempotent, you have just double-counted.
Our take: for ad-click aggregation, this section is the interview. Pinterest's ad-click aggregation prompt is an onsite report dated 2026-08. If the interviewer says the clicks are billed, a double count becomes a correctness bug, so lead with event-ID deduplication and windowed aggregation with an explicit cutoff for late events, then talk storage.
What should happen when storage falls behind?
Slow producers or shed load in a planned order, and never buffer without limit. PracHub's guide warns against unlimited in-memory queues that hide the problem until processes crash, and it suggests deciding an emergency degradation order before the incident. PracHub's order is concrete: "protect service-level and billing metrics, sample diagnostic series, and reject newly exploding label sets".
According to bugfree.ai's Medium post, ingestion pipelines should apply backpressure to slow producers during high load. That covers one half of the answer. The other half is admission control per tenant, so one tenant's label explosion cannot starve the others.
TrueInterview's site quotes one candidate's reported follow-up, not tied to a metrics prompt: "What breaks first at 10× the traffic?" Our take: prepare an answer to that question for your pipeline anyway, and name candidates such as the active-series index or the storage write rate rather than the ingest gateway.
Our take: a durable, partitioned log with bounded consumer lag and a pre-agreed shedding order beats any clever in-memory buffer. Name the order, and name the metric that triggers it.
How should retention, rollups and the query path work?
Tier by age and by criticality, and serve dashboards from rollups. According to bugfree.ai's Medium post, hourly or daily rollups belong in a separate table, logs should be partitioned by time and service ID, and high-priority logs kept for longer. These are one author's views.
One author's Medium mock interview describes moving logs to a cheaper tier such as Glacier after 30 days, with the storage service enforcing GDPR-style retention and deletion. The same author describes the push-versus-pull trade: pull adds latency from polling intervals, and push adds agent overhead on each service. Our take: for logs, we would push from a local agent with a bounded disk buffer, and keep pull for metrics scraping where the collector should control the rate.
In one author's mock interview, the interviewer asks, "Why Kafka over other messaging systems?" The same author describes Kafka's operational complexity and Elasticsearch's memory-intensive tuning as the costs. Our take: expect the same kind of challenge, and justify the log by the properties you need, namely durable storage, replay from an offset and partitioning by series hash, before you name a product.
What do alerting prompts test?
Our take: a strong answer leads with noise discipline, not anomaly detection, and that view rests on Google's SRE guidance rather than on interview reports. DoorDash's Design an alert notification system is linked from 3 write-ups, all from senior-or-above candidates. Start with which conditions page a human, which only open a ticket, and how repeated alerts for one incident are grouped.
Google's SRE book sets the standard: "Effective alerting systems have good signal and very low noise." It warns that when pages come too often, people skim or ignore them, sometimes missing a real page masked by the noise. It says you should never alert simply because something seems a bit weird. It also says Google avoids systems that try to learn thresholds or detect causality automatically, and has had only limited success with complex dependency hierarchies.
For the dashboard half, the SRE book says dashboards should normally include some form of the four golden signals. The SRE book distinguishes white-box monitoring from internal metrics and logs from black-box monitoring of what a user sees.
Our take: in an alerting prompt, spend your time on deduplication of repeated alerts, routing, escalation and silencing, and keep anomaly detection to one sentence about why you would not page on it.
Worked example: Design Metrics System from contract to alert
Practise this prompt first, because it is the most-linked title in the set and nine of its ten write-ups come from senior-or-above candidates. Amazon's onsite report of it is dated 2026-07. The sequence below uses only the decisions covered above.
- Contract. State the series key and a per-tenant active-series cap, and refuse user-ID labels with the reason.
- Write path. Define the acknowledgment as durably queued, partition the log by series hash, and checkpoint only after idempotent writes commit.
- Aggregation. Take deltas from clients, convert them in the partition that owns the series, and store counter sums and histogram state.
- Retention. Keep raw resolution briefly, keep mergeable rollups longer, and say why stored percentiles are never averaged.
- Overload. Give the shedding order and the lag metric that triggers it.
- Alerting. Page on a small set of user-facing signals, and send the rest to dashboards.
If the interviewer cuts you off early, protect the series key and the acknowledgment contract. They carry the cost and correctness decisions; the rest can be stated in a sentence each.
What changes at senior and staff level?
The expectation moves from drawing the pipeline to owning its cost and failure modes. In the core metrics and logging family, write-up links split 27 senior-or-above to 5 junior-or-below. Event Ingestion + Top-K Aggregation has 2 senior-or-above write-ups and none from junior candidates.
The content-aggregation prompts are less skewed. Design a News Aggregation Feed splits 5 senior-or-above to 2 junior-or-below, and Design Book Price Aggregator 4 to 2. Design Ad Click Event Aggregation System sits in between, with 3 of its 4 write-ups from senior-or-above candidates. Levels here are the ones candidates reported themselves. Our take: these samples are small and every family skews senior, but the telemetry and alerting prompts skew furthest, so treat them as the senior-loop versions of this round.
Our take: at senior level, expect to defend a cardinality budget, the choice between delta and cumulative temporality, and the shedding order under overload. At staff level, expect to be asked who owns the budget across tenants, how a new team onboards without breaking it, and how you would migrate an existing pipeline without losing data.
Down-leveling note (our view): in a senior loop, this design round carries much of the level signal, along with the project deep dive and behavioral scope. A correct pipeline that never addresses cardinality, acknowledgment semantics or overload reads as mid-level, and that is a risk to a senior offer.
How we counted
Counts come from TrueInterview's question bank as of 2026-10-18. They are candidate-reported questions reconstructed for practice, not any company's official question list. Families are assigned from question titles, a question can be filed under several companies and reported in several rounds, and level splits count write-up links by each candidate's self-reported level. A link count measures what candidates wrote up, not how often a company asks a question.
FAQ
What do metrics and logging system design interviews actually test?
PracHub's guide frames them as preserving meaning while reducing write volume, and we agree. In practice that means defining a series and a cardinality budget, keeping rollups mergeable, stating what an acknowledgment promises, and planning for overload. In our view, tool choice matters mainly as a follow-up about why you picked it.
How do you handle high-cardinality labels in a metrics system?
Refuse unbounded values such as user IDs as labels, cap active series per tenant and per metric, and reaggregate away the attributes you do not need (see the section on defining the pipeline). Move per-user detail into logs or traces with sampling and their own retention. If a tenant's series count spikes, reject the new label sets before they reach storage instead of letting them crowd out core metrics.
Should log and metric ingestion be push or pull?
Use push from a local agent for logs, because services emit logs continuously and an agent can buffer to disk when the backend is slow. Pull fits metrics scraping where the collector should control the rate and detect a target that has gone silent. Whichever you pick, say what the agent does when the backend is down and how much it is allowed to buffer.
How do I design a logger system for an interview?
Check which question you have first. A logging library or a logger that suppresses repeats starts from a component's API and its suppression rules, while a distributed logging system is a platform design. Hello Interview's community page lists a version that also adds multiple applications and search, so scope it with the interviewer. The library version appears in write-ups from senior-or-above candidates too. Prepare both, and ask the interviewer which one they mean before you draw anything.
Do phone screens include metrics and logging design?
Yes, in a scoped form (see the phone-screen count above). Apple's Ads Click Aggregator and OpenAI's electricity-monitoring prompt are both phone-screen reports. Expect a narrower prompt, and spend your time on the data model, the write path and the acknowledgment contract instead of storage tiers and dashboards.
Your practice plan
A three-week plan for someone working full time, about an hour on weekdays:
- Week one, first half. Write a one-paragraph series key and cardinality budget for Design Metrics System, and practise saying why user IDs are not labels.
- Week one, second half. Write down what your ingest acknowledgment means, where deduplication happens and when offsets are checkpointed, then answer the crash-before-checkpoint question aloud.
- Week two, first half. Do one timed design of Design Ad Click Event Aggregation System, focusing on event-ID deduplication and late events.
- Week two, second half. Do Design an alert notification system with a paging policy, deduplication and escalation, and no learned thresholds.
- Week three, first half. Pick the variant your target company's reports point to: Metrics & Monitoring Platform for LinkedIn, Event Ingestion + Top-K Aggregation for Oracle, or Real-Time Electricity Monitoring and Policy Control for OpenAI.
- Week three, second half. If a library round is possible, sketch Cross-Platform Logging Library as an object design. Then rehearse a half-hour phone-screen cut of Design Metrics System that stops after the write path.
Sources
- TrueInterview question bank — metrics, logging and data pipeline design at big-tech companies — counted 2026-10-18
- Design a Logger System | Hello Interview — checked 2026-10-18
- Metrics Ingestion System Design Interview: Cardinality, Aggregation, and Backpressure | PracHub Knowledge Hub — checked 2026-10-18
- Metric and label naming | Prometheus — checked 2026-10-18
- Metrics Data Model | OpenTelemetry — checked 2026-10-18
- Medium — checked 2026-10-18
- Interview prep compared: your application, end to end · TrueInterview — checked 2026-10-18
- Medium — checked 2026-10-18
- Google SRE: SRE Responsibilities and Management Frameworks — checked 2026-10-18
Last reviewed: 2026-10-18.